BIOPRO2 research center (2015-19)
The BIOPRO2 research center aimed to optimize bio-based production processes through the combined use of advanced sensors, statistical modeling, mathematical process models, and information visualization. I was leading a work package focused on how interactive visualizations can help overview and explore sensor data, and work more efficiently with mechanistic process models and statistical models.
One project combined visualizations of streaming process data and model predictions, which resulted in an interactive tool for plant operators called Schedulater.

- Knudsen, S., and Jakobsen, M. R. (2016). Schedulater: Supporting Plant Operators in Scheduling Tasks by Visualizing Streaming Process Data and Model Predictions. Posters of the IEEE Information Visualization Conference (InfoVis). [local] [A0 poster] [video]
WallViz research project (2011-15)
The strategic research project WallViz aimed for “improving decision making from massive data collections using wall-sized, highly interactive visualizations”. I was mainly responsible for a work package on developing hardware and interaction techniques for large-display visualization.

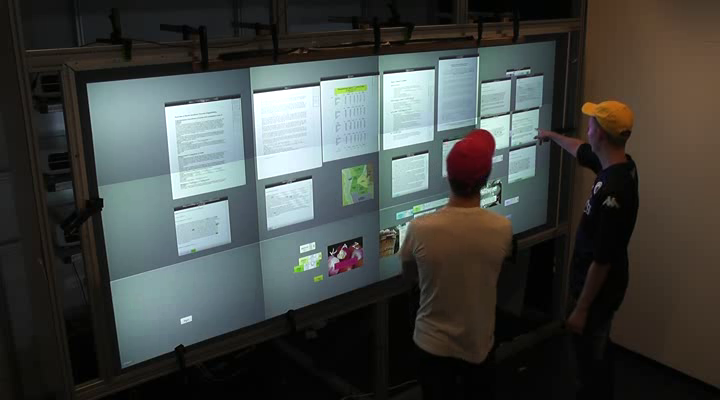
Much of my research in the project was carried out on a custom built wall-display (see figure). The display prototype provides a seamless high-resolution display surface (24.8 megapixels, 7680×3240 pixels, 2.8×1.2 meter). The figure shows the display prototype that supports both multi-touch input (using rear-mounted infrared cameras) and 3D tracking of users and objects (using a commercial marker-based motion capture system).
Wall-display interaction
We have studied interaction techniques for wall-displays using a range of input methods: mouse input, touch, mid-air gestures, and body movement. For example, we have adapted text-entry methods for use in mid air around the large display (Markussen et al., 2013; Markussen et al., 2014, Markussen et al. 2015) and compared them to touch-based alternatives.

Also, we have studied physical movement (i.e., locomotion) in zoom-and-pan interfaces for wall-displays, isolating the effects of physical navigation using body movement vs. virtual navigation using a mouse (Jakobsen & Hornbæk, 2014). We have compared touch and mid-air gestures for interacting with wall-displays, in particular to understand how people choose between touch and mid-air input under different circumstances (Jakobsen et al. 2014). Recently, we have studied how users can benefit from interacting with content beyond the boundaries of the display through mid-air pointing (Markussen et al., 2016).
- Markussen, A., Boring, S., Jakobsen, M. R., Hornbæk, K. (2016). Off-Limits: Interacting Beyond the Boundaries of Large Displays. Proc. CHI ’16. ACM, 5862-5873. [local] [doi] [video]
- Jakobsen, M. R., and Hornbæk, K. (2015). Is Moving Improving? Some Effects of Locomotion in Wall-Display Interaction. Proc. CHI ’15, ACM, 4169-4178. [local] [doi]
- Jakobsen, M. R., Jansen, Y., Boring, S., Hornbæk, K. (2015). Should I Stay or Should I Go? Selecting Between Touch and Mid-Air Gestures for Large-Display Interaction. Proc. INTERACT 2015, Springer, 455-473. [local] [doi]
- Markussen, A., Jakobsen, M. R. & Hornbæk, K. (2015), Text Entry for Large High-Resolution Displays. Workshop on Text Entry on the Edge, CHI2015.
- Markussen, A., Jakobsen, M. R., and Hornbæk, K. (2014). Vulture: A Mid-Air Word-Gesture Keyboard. Proc. CHI ’14. ACM, 1073-1082. Best Paper Award. [local] [video] [doi]
- Markussen, A., Jakobsen, M. R., and Hornbæk, K. (2013). Selection-Based Mid-Air Text Entry for Large Displays. Proc. INTERACT 2013. Springer, 401-418. [doi]
Large-display visualization
We have adapted visualizations to large displays and explored new visualizations for large displays. We conducted empirical studies investigating the interrelation between display size, information space, and scale in comparisons of focus+context, overview+detail, and zooming interfaces – classic interactive multi-scale visualization techniques (Jakobsen & Hornbæk, 2013)

Also, we have investigated how visualizations on wall-sized displays can adapt to users’ movement, using tracking data as input (Jakobsen et al., 2013). This research explored dynamically changing visualizations through a taxonomy-driven analysis and through user studies of three prototypes that map different visualization tasks to different types of movement. We also have done workshops with data analysts from varied domains, to identify potentials for using display space and visualizations to support analysts’ workflows during collaborative analyses (Knudsen et al., 2012).
- Jakobsen, M. R. and Hornbæk, K. (2013). Interactive Visualizations on Large and Small Displays: The Interrelation of Display Size, Information Space, and Scale. IEEE TVCG, vol. 19, no. 12, Dec. 2013, 2336-45. [local] [video] [doi]
- Jakobsen, M. R., Haile, Y. S., Knudsen, S., and Hornbæk, K. (2013). Information Visualization and Proxemics: Design Opportunities and Empirical Findings. IEEE TVCG, vol. 19, no. 12, Dec. 2013, 2386-95. [local] [video] [doi]
- Jakobsen, M. R. and Hornbæk, K. (2013). Proxemics for information visualization on wall-sized displays. POWERWALL: International Workshop on Interactive, Ultra-High-Resolution Displays, CHI 2013. [local]
- Knudsen, S., Jakobsen, M. R., and Hornbæk, K. (2012). An Exploratory Study of How Abundant Display Space May Support Data Analysis. In Proc. NordiCHI. ACM, 558-567. [doi] [local]
- Jakobsen, M. R. and Hornbæk, K. (2011). Sizing Up Visualizations: Effects of Display Size in Focus+Context, Overview+Detail, and Zooming Interfaces. Proc. CHI 2011, ACM, 1451-1460. [doi] [local]
Wall-display collaboration
Finally, we have conducted empirical studies investigating how groups collaborate around wall-displays (Jakobsen & Hornbæk, 2012; Jakobsen & Hornbæk, 2014). This research has sought to characterize the benefits of these displays for co-located collaboration. We have also experimentally compared the influence of input methods, multitouch and multiple mice, for collaboration tasks using wall-displays (Jakobsen & Hornbæk, 2016).
- Jakobsen, M. R., and Hornbæk, K. (2016). Negotiating for Space? Collaborative Work Using a Wall Display with Mouse and Touch Input. Proc. CHI ’16. ACM, 2050-2061. [local] [doi]
- Jakobsen, M. R. and Hornbæk, K. (2014). Up close and personal: Collaborative Work on a High-Resolution Multi-Touch Wall-Display. ACM Transactions on Computer-Human Interaction, 21, 2, Article 11 (April 2014), 34 pages. [local] [doi]
- Jakobsen, M. R. and Hornbæk, K. (2012). Proximity and Physical Navigation in Collaborative Work With a Multi-Touch Wall-Display. Proc. CHI EA ’12, ACM, 2519-2524. [doi] [local]
Previous (doctoral) research
My doctoral research below was about information visualization for programming environments and interactive visualization techniques for navigation.
Fisheye views of source code
This line of work investigates how fisheye interfaces can support programmers. We developed a fisheye view in the Java editor of Eclipse and evaluated its usability: in controlled experiments, which indicated benefits in navigating and understanding source code; in a field study, which showed how professional programmers adopted and used the fisheye editor in their own work.
An Eclipse plug-in with the fisheye Java editor used in the CHI 2009 study can be download for use as-is. Follow the instructions for installing the fisheye editor plug-in.
- Jakobsen, M. R. and Hornbæk, K. (2011). Fisheye Interfaces—Research Problems and Practical Challenges. To appear in A. Ebert, A. Dix, N. Gershon, and M. Pohl (Eds.), HCIV (INTERACT) 2009, LNCS 6431. Springer, 76–91. [doi] [local]
- Jakobsen, M. R. and Hornbæk, K. (2009). Fisheyes in the Field: Using Method Triangulation to Study the Adoption and Use of a Source Code Visualization. Proceedings of CHI ’09, ACM Press, 1579-1588. [doi] [local]
- Jakobsen, M. R. and Hornbæk, K. (2006). Evaluating a fisheye view of source code. Proc. CHI ’06, ACM Press, 377-386. [doi] [local]
Large display visualization for software teams

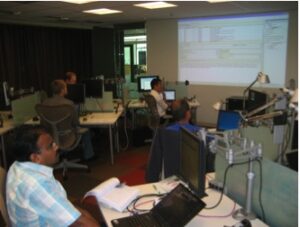
This work in collaboration with researchers at Microsoft Research investigates how visualization can support coordination in software development teams. We developed WIPDash: a visualization that shows work items and team activity. The visualization was deployed with two collocated software teams, both on a large display in the team room and on individual team members’ workstations, for a one-week field study.
- Jakobsen, M. R., Fernandez, R., Czerwinski, M., Inkpen, K., Kulyk, O., and Robertson, G. (2009). WIPDash: Work Item and People Dashboard for Software Development Teams. Proc. INTERACT ’09, Springer, 791-804. [doi] [local]
Navigation among documents

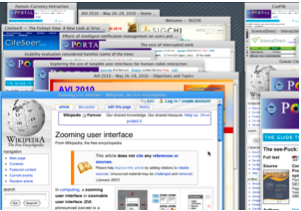
This work investigates interface techniques for helping people to navigate among multiple documents. Navigation among documents is a frequent activity in for instance web browsing or programming, but an activity that is not well supported in widespread interfaces. We explore interfaces that use automatically arranged piles of documents and compare them with commonly used interface approaches.
- Jakobsen, M. R. and Hornbæk, K. (2010). Piles, Tabs and Overlaps in Navigation among Documents. Proc. NordiCHI ’10, ACM Press, 246-255. [doi] [local]
Transient visualizations
Investigates how visualization techniques can be used transiently so as to support specific tasks without permanently changing the interface.

